At long last, a rainy February enabled us to augment our 2013 flow study with wet weather data to calculate the mass volume of fecal coliform bacteria in four Humboldt Bay tributaries (Janes, Jolly Giant, Jacoby, and Campbell Creeks).
We found that during wet weather, Janes Creek carries more than 75% of the E. coli carried by the four streams into Humboldt Bay – a whopping 375 lbs. per day!
E. coli is a type of fecal coliform bacteria found in the guts of warm-blooded animals, including humans. It is an indicator of a range of pathogenic bacteria and viruses found in feces, all of which can make people sick. The state sets a limit of 235 to 576 MPN/100 mL* for waterways that are used for contact recreation, such as swimming, wading, fishing, surfing, or boating. Children are especially susceptible to illness from playing in small streams and coastal waters polluted with coliform bacteria, which can cause diarrhea, stomach cramps, and vomiting.
This type of water pollution also impacts the local shellfish industry, which relies on clean water. Humboldt Bay is certified for oyster cultivation, and the majority of oysters sold in California are grown here. During major rain storms, commercial oyster farmers are required to suspend harvesting. This occurs approximately 30 days a year on average. That’s because the rainfall runoff funnels E. coli and other pollutants into the creeks and, ultimately, into the Bay where oysters are grown.
 The goal of this study was to identify which creek is discharging the highest mass volume of E. coli into the Bay. Thanks to support from the Cereus Fund in 2013, we consulted with hydrologists at Pacific Watershed Associates who trained our staff to measure stream flow rates and develop hydrologic rating curves for four creeks that flow into Arcata Bay. We measured low flows throughout the exceptionally dry autumn. We also shared our October flow measurements with hydrologist Randy Klein to add to the low-flow hydrograph for Jacoby Creek, which is monitored during higher flows at a gaging station in Bayside.
We combined E. coli concentrations with flow measurements to calculate the mass volume of bacteria that is actively discharging into our Bay from each creek. Our previous monitoring events only measured concentrations of E. coli – a measure of grab samples taken during dry weather and “First Flush,” the first major rainstorm of the water year. Over seven years, we detected and identified concentrations of E. coli that exceeded Water Board standards in most local streams. The highest levels were found during the First Flush, when the first major storm washes pollutants into streams. During low flow, illicit detections can help-better pinpoint pollutant source locations. Monthly sampling is necessary to better understand the pollutant-flow regime.
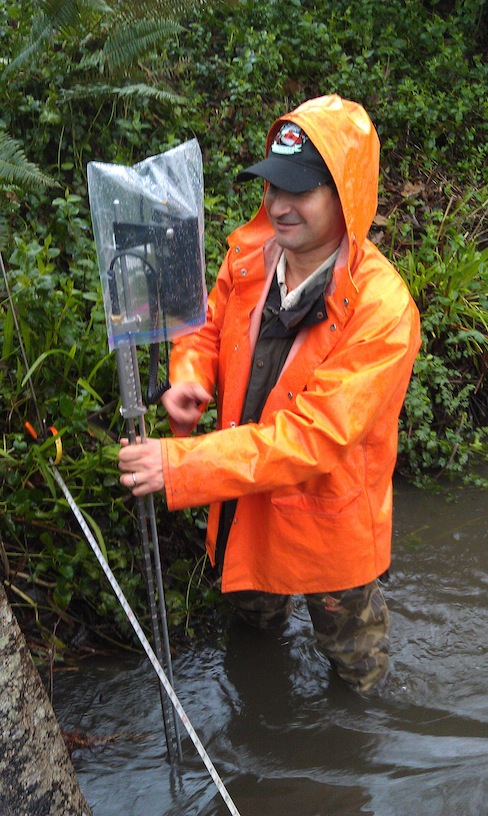
Left: Todd Kraemer of Pacific Watershed Associates measures the flow rate in Jolly Giant Creek.
This winter’s study found that during wet weather, Janes Creek carries more than 75% of the E. coli carried by the four streams into Humboldt Bay – a whopping 375 lbs. per day!** In technical terms, that’s a concentration of 3,890 MPN/100 mL combined with a flow rate of 18 cubic feet per second (cfs) on Feb. 13.
During our dry weather monitoring on Oct. 3, Jolly Giant Creek carried close to 50% of the total E. coli measured, suggesting a different source of this type of water pollution during dry versus wet weather.
We will use these findings to develop a monitoring plan to more closely examine these two creeks using molecular techniques to identify the source animals with the goal of identifying and reducing or eliminating a major source of anthropogenic water pollution in Humboldt Bay. The ultimate goal is to develop strategies for reducing or eliminating this type of pollution and to educate local residents, sewer providers, and land managers about how we can all help improve water quality throughout the Humboldt Bay watershed.

Thanks to the Cereus Fund of the Trees Foundation; Todd Kraemer, Jack Skeahan, and the rest of the PWA team; Randy Klein; Erick Burres of the State Water Resources Control Board's Clean Water Team; the City of Arcata Department of Environmental Services; and Kerry McNamee and all the volunteers and staff of Humboldt Baykeeper whose efforts over the past 9 years led to this project. You know who you are!
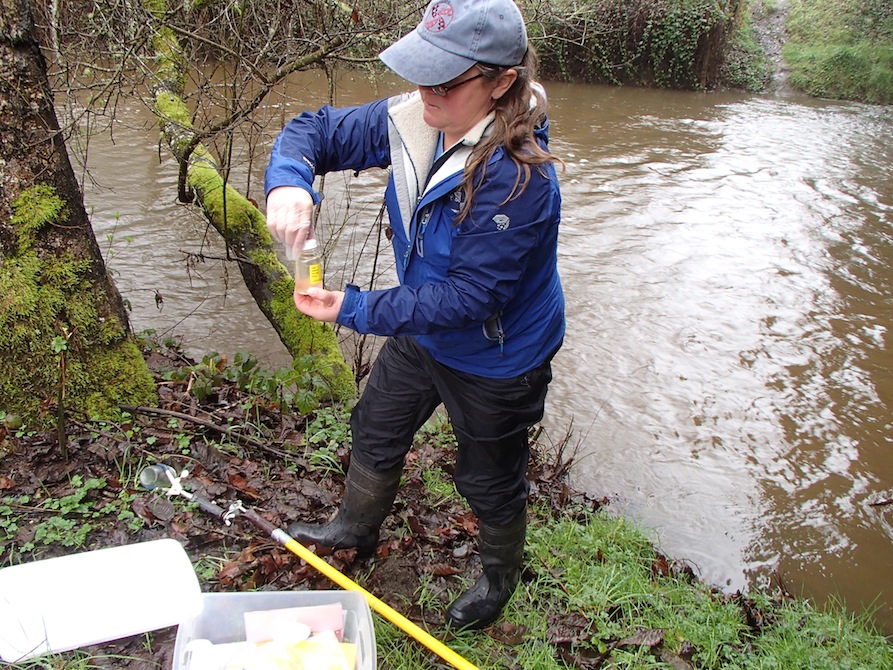
Left: Jennifer Kalt of Humboldt Baykeeper collects a sample from Jacoby Creek to be analyzed for E. coli. Coho were swimming upstream while we were sampling!
________________________________________________________________________________________________
*The limits set by the state and U.S. EPA depends on how frequently the waterbody is used for “full contact recreation” (e.g. swimming, surfing, etc.). MPN/100 mL is the standard unit of measurement for coliform bacteria in water. It is an estimate of the number of bacterial colony forming units counted after the samples are cultured in the laboratory.
**[(x MPN/100 mL) x (1/1,000,000,000 g) x (1000 ml/L) x (28.3168 L/cubic foot) x (flow rate in cfs/sec) x (86,400 seconds/day)] / (453 g) = E. coli in lbs./day


