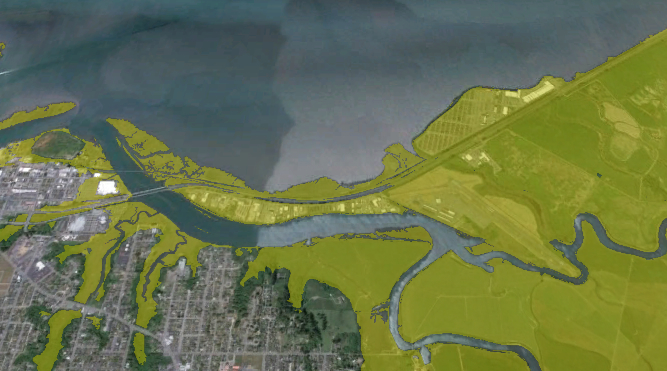
Inundation maps were developed by Jeff Anderson of Northern Hydrology & Engineering for the Humboldt Bay Sea Level Rise Vulnerability Assessment Project. The maps show areas vulnerable to existing and future sea levels that are currently protected from inundation due to the natural shoreline, dikes or berms, and railroad or road grades.
Above: Northeastern Eureka and Highway 101 with a half-meter of sea level rise, which is currently predicted for the year 2050.
Five scenarios were assessed: existing conditions for Year 2012, and increments of 0.5, 1.0, 1.5, and 2 meters of sea level rise above Year 2000. Inundation maps were produced for each SLR scenario for mean higher high water (MHHW), mean monthly maximum water (MMMW), mean annual maximum water (MAMW), and 10-year and 100-year flood events.
The maps are provided as kmz files which can be opened in Google Earth, and as shapefiles which can be imported into GIS software such as ArcGIS.
Click HERE for links to download the maps, shapefiles, and associated reports.
Click HERE for more info on the Humboldt Bay Sea Level Rise Vulnerability Assessment Project.


